
ENSENSIA mini
The Accurate way to monitor air quality.
Air Quality.
Visible!
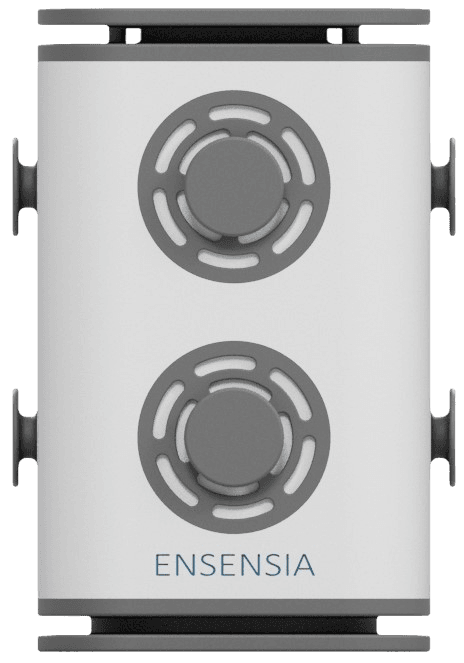
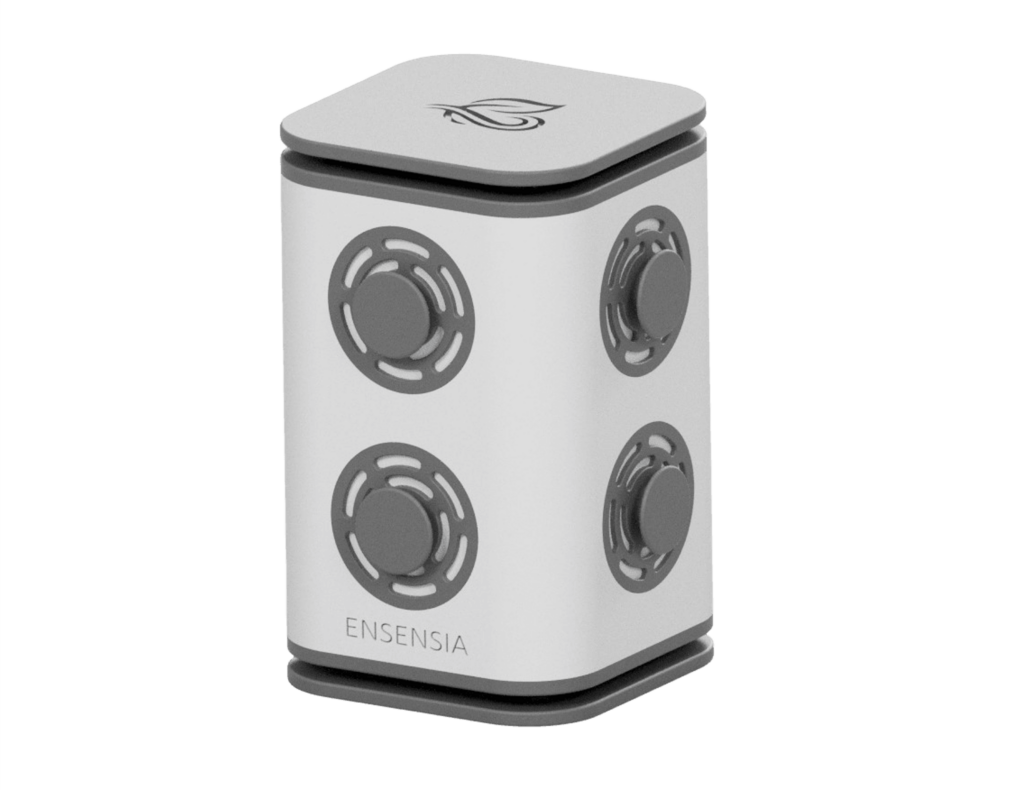
ENSENSIA is a comprehensive air quality monitoring solution designed for professional applications in both indoor and outdoor environments. It integrates advanced IoT sensors, data analytics algorithms, and a cloud-based platform to deliver precise and continuous measurements of key air quality pollutants
Applications
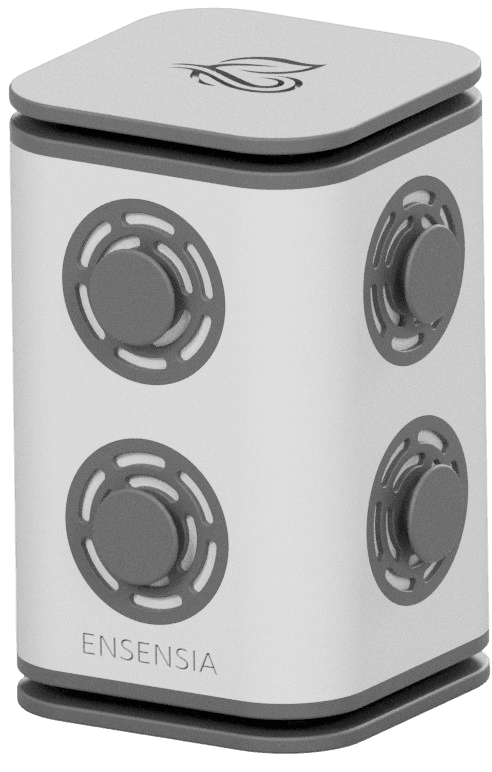
Indoor air quality monitoring in offices, schools & healthcare facilities
Outdoor air pollution monitoring & Smart City networks
Industrial site and workplace exposure assessment
Research studies & field campaigns on air quality and pollutants
Continuously evaluated by:


Customize it yourself
PM2.5 (Fine Particles ≤2.5 μm)
µg/m³Tiny airborne particles that can penetrate deep into the lungs and enter the bloodstream. Short-term exposure can worsen asthma and cardiovascular symptoms, while long-term exposure increases the risk of heart disease, stroke, lung cancer, and overall mortality. Major sources include smoke (from outdoors or cooking), vehicle emissions, and resuspended dust.
Total VOCs (Volatile Organic Compounds)
ppbA lumped measure of many gases emitted from paints, cleaning products, furnishings, and human activities. Short-term effects include irritation, headaches, and nausea while long-term risks depend on which VOCs are present (e.g., formaldehyde, benzene). Source control and ventilation matter more than chasing a single “safe” TVOC number.
CO₂ (Carbon Dioxide)
ppmNot a toxic ”pollutant” at normal levels, but an important indicator of ventilation quality. Elevated indoor CO₂ often coincides with stuffy air and can contribute to sleepiness and reduced cognitive performance. Extremely high levels are unsafe, though rare in typical indoor environments.
NO₂ (Nitrogen Dioxide)
ppbAn airway irritant that can inflame the lungs, worsen asthma, and increase susceptibility to respiratory infections. Peaks are driven by traffic, gas stoves or heaters, and other combustion sources. Children and people with lung conditions are especially sensitive.
O₃ (Ozone)
ppbA strong oxidant that irritates the eyes and respiratory tract, causing coughing, chest tightness, and shortness of breath. It can also trigger asthma attacks. Outdoor ozone can infiltrate indoor spaces — avoid “ozone generators” marketed as air purifiers.
Temperature (T) & Humidity (RH)
°C · %RHTemperature (T) — Not a pollutant, but central to wellness: thermal comfort affects mood, sleep quality, and productivity. Too hot raises risk of heat stress, dehydration, and restless sleep; too cold can impair dexterity and, at extremes, risk hypothermia—aim for a comfortable, stable range suited to activity and clothing.
Humidity (Relative Humidity, RH) — Also not a pollutant; key for comfort and indoor ecology. Low RH dries skin and airways (scratchy throat, nosebleeds), while high RH promotes mold and dust mites and can make spaces feel muggy. A mid-range (often ~40–60%) generally supports comfort, better sleep, and fewer moisture-related issues.
CO
Replace either the NO2, O3, or Total VOCs sensors with this sensor
HCHO
Replace either the NO2, O3, or Total VOCs sensors with this sensor
SO2
Replace either the NO2, O3, or Total VOCs sensors with this sensor
AI-powered
Every low-cost sensor faces bias and drift — but AI fixes that. Using advanced Machine Learning and Deep Learning, we dynamically correct ENSENSIA readings for unmatched precision.
Small and easy to install device
Weather-resistant and compact, the system installs in just five minutes. Perfect for quick, seamless setup.
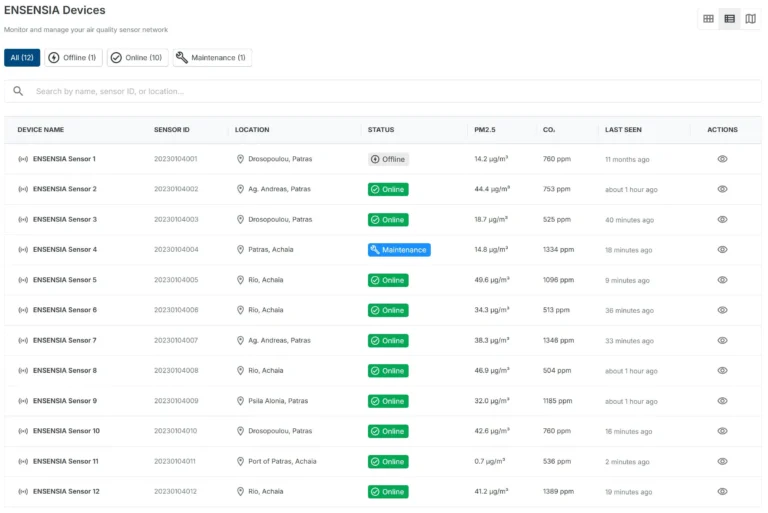
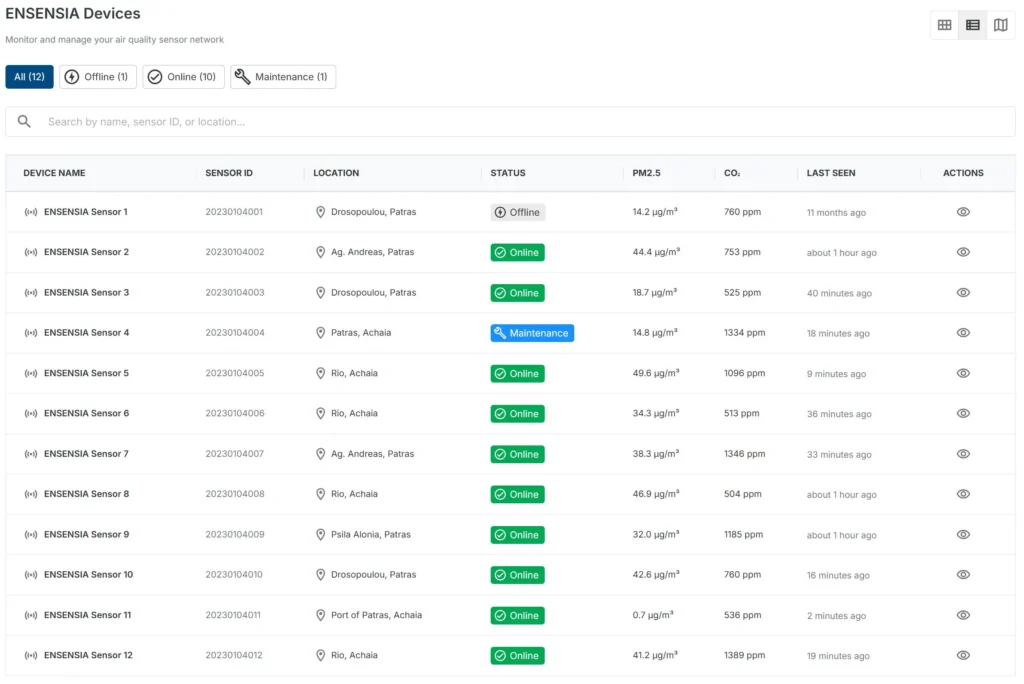
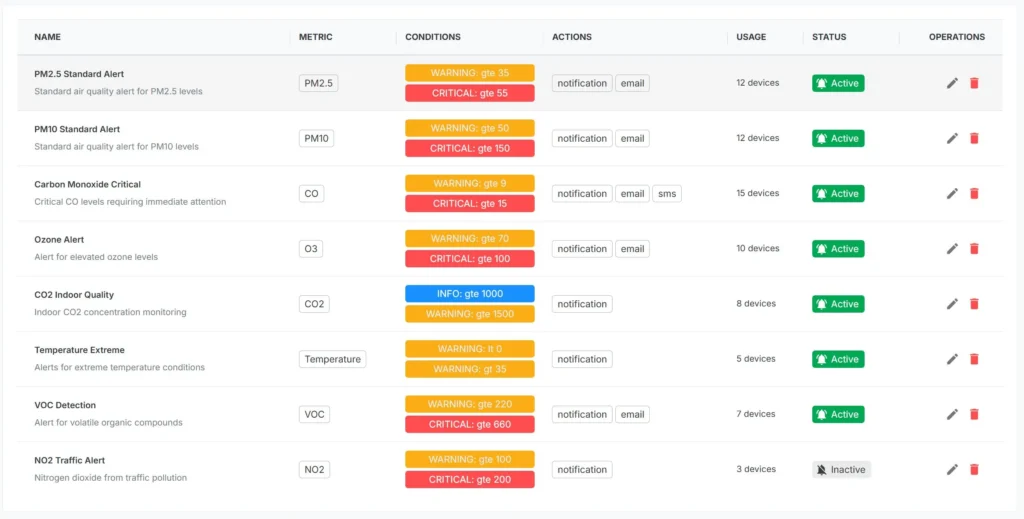
Accessible via Data Platform, Map and App
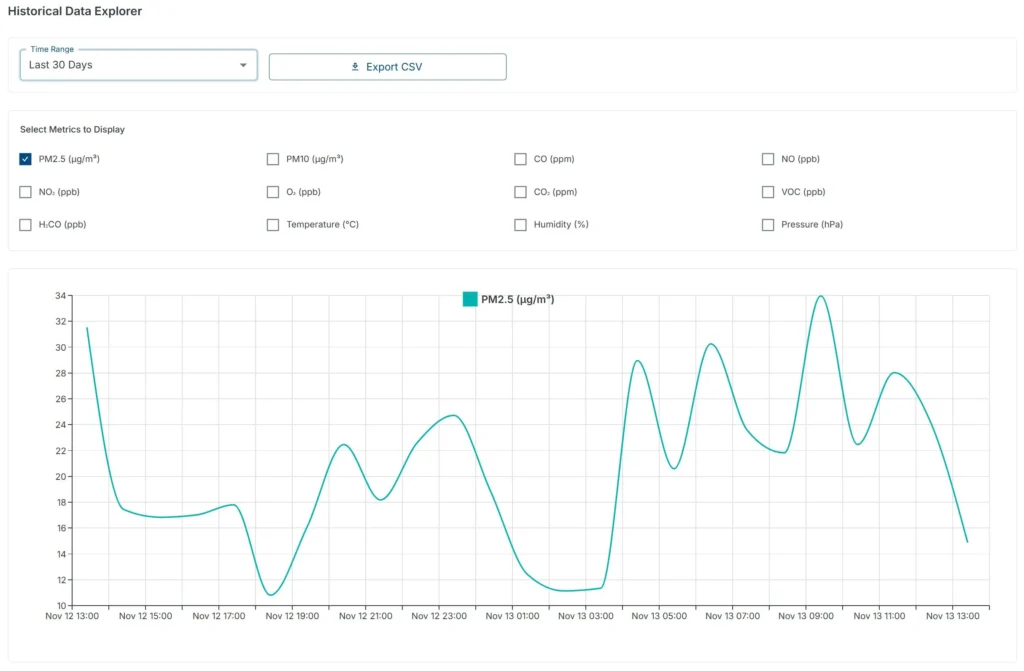
Seamlessly access real-time and historical air quality and gas data anytime, anywhere, through web and mobile platforms.
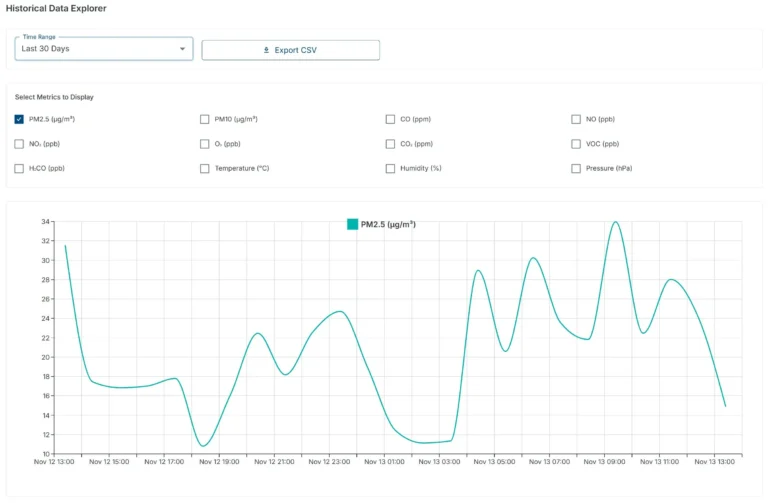
Customisable & accurate gas sensing
Remotely managed through the platform, with customizable calibration options to address specific local needs and policy goals.
Weatherproof
Indoor: Dust-resistant and splash-resistant
Outdoor: Furnished and assembled with durable material and design for deployment ambient
Air Quality LED indicator
Equipped with LED status indicators and a color-coded air-quality readout
API
Easy integration to smart city systems and third-party apps
Specifications
Sensors
| Sensor | Technology | Units | Range | Lifespan |
|---|---|---|---|---|
| PM2.5 | Laser | ug m-3 | 0-500 | >5 years |
| CO | Electrochemical | ppb | 0-10.000 | > 3 years |
| NO | Electrochemical | ppb | 0-400 | > 3 years |
| NO2 | Electrochemical | ppb | 0-400 | > 3 years |
| O3 | Electrochemical | ppb | 0-200 | > 3 years |
| CO2 | NDIR | ppm | 400-10.000 | > 15 years |
| Total VOC | Electrochemical | ppb | 0-15.000 | > 3 years |
| Temperature | CMOS-based | Celsious | -40-85 | > 15 years |
| Rel. Humidity | Capacitive sensing | % | 0-100 | > 15 years |
Connectivity
| 2.4 GHz and 5.0 GHz IEEE 802.11ax wireless | Default |
| Cellular 4G/LTE (optional) | optional |
Operating working conditions
| Operating temperature range | -40 to 60 Celsious degrees |
| Operating RH range | 0 - 99 %RH |
Measurements frequency
| Sampling interval | 1 - 2 seconds |
| Averaging interval | 2 minutes (adjustable) |
| Sending interval | 2 minutes (adjustable) |
Enclosure parameters and weight
| Case material | ASA EVO plastic with UV protection |
| Dimensions | 13 x 13 x 8.3 cm |
| Weight | 0.5 Kg |
Power Supply and Energy Consumption
| Supply Voltage | Power over Ethernet (PoE) - Cable for 220-240V AC 50 Hz input included |
| PoE | Yes |
| Average Power Consumption | 3.5 W |
| Battery | Enough for 10 hours |
Gallery
Air Quality. Visible!
Tell us about your site and we will size the right ENSENSIA mini deployment for it.
Get a quote
